After the Finish Line: How a Season of Club Racing Actually Gets Scored
You cross the line, you're done. Or so it feels. Your legs are still jello, your heart rate is still climbing on the cooldown, and for about ten minutes the only number that matters is how you felt. Then someone asks "so what position were you?" — and everything after that starts happening somewhere else. For most clubs, "somewhere else" is a spreadsheet on an admin's home desk, or a memory that fades by the next race.
That's the part of club racing nobody explains to new riders: the race itself is just data entry for the season. Here's what actually happens after the finish line — line-ups, points, primes, and standings — from the rider's side of it. And why I ended up building a free platform so clubs can stop running all of it through Excel.
The line-up decides who you're racing
Before a single wheel turns, every event has a line-up: the riders registered for each race, with their grade and their category. Grade is the class within the event (the Grade 1, Grade 2, Grade 3 tabs you see on a results page), and category is where you sit in the club's age/ability structure.
From a rider's perspective this is the whole game. In club racing you're not trying to beat the fastest person in the field — you're trying to beat the riders in your own grade. A mid-pack senior who finishes second in his race can outscore someone three grades up who won outright, because the points are awarded within the class. That's also why line-ups are load-bearing: if your name isn't on it, or you're listed in the wrong grade, the result doesn't count where it should — and that's usually discovered at the end of the season, not on race day.
Points: the number that actually matters
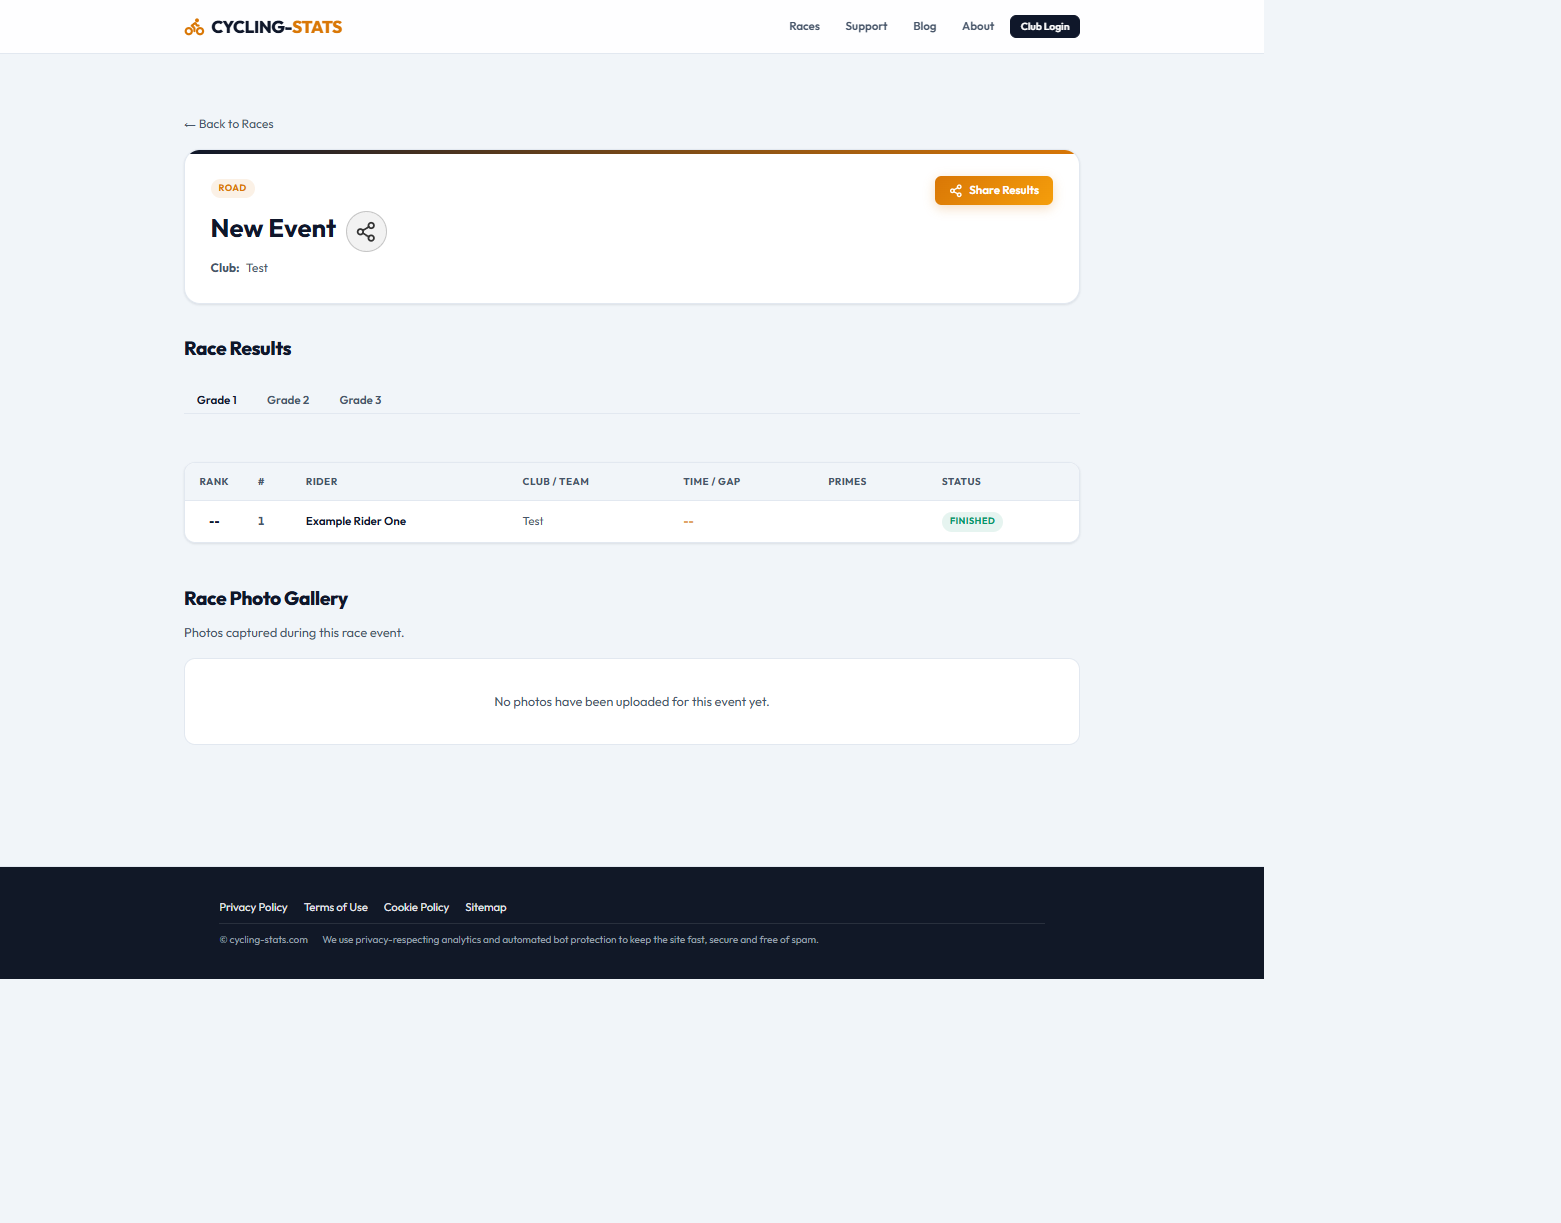
When a race finishes, the results table gets filled in: rank, rider, club, time or gap to the winner, and points. Positions convert to points — the exact table varies by event, but the shape is always the same: the higher you finish, the more you bank, and it tapers down the field so a fifth place still counts for something.
That's what makes club racing different from a one-off criterium. A single race result is a data point; the points are the record. Every race adds a row to your season, and the time/gap column tells you how close "better" actually was — twelve seconds off the pace or forty, which changes what you work on next week.
I treat my own results this way: after every race I write down position, gap to the winner, and where I lost it (the break, the feed zone, the last 200 metres). It's a dataset with one row per race, and by round six of a season you can see patterns that no amount of feeling will tell you.
Primes: points inside the race
Then there are primes — intermediate sprints held before the finish, marked on the course (a line across the road, or a lap marker on the track). The first rider through the prime takes extra points on top of whatever the final result gives them.
For mid-pack riders, primes are where you actually score. A prime win is a result you can bank even on a day when third in the bunch isn't happening, and over a season they add up — which is why the results table carries its own column for them, next to each rider's row.
The standings: what a season actually looks like
Once points are banked, they accumulate into standings — per event (who won this series of races) and per season (who leads across all of them), broken down by category so every rider is ranked against their own class.
This is the difference between "I won that one race in March" and "I'm second in senior for the season." As a rider, the season leaderboard is your training feedback loop: it shows you exactly where you stand relative to the people you race every week, without asking anyone or digging through emails. As a club, it's what keeps a season coherent — everyone can see the same numbers at any time, not just after someone gets around to updating the spreadsheet.
The spreadsheet problem
Here's the uncomfortable part: all of this is simple, and "simple" is exactly why so many clubs run it on paper and Excel. Someone writes results on a clipboard during the race, types them into a spreadsheet at home that night, fixes the typos, emails the updated version around, and prays the file doesn't get lost.
The failure modes are predictable:
- Errors compound. A missed point in round three quietly changes who leads the season by round nine — and nobody notices until someone asks.
- The data lives on one person's laptop. When that admin moves clubs (or just reorganises folders), the season history goes with them.
- Riders can't see their own trajectory. You want to know where you stand? Email the admin and wait.
- It's unpaid work, done after a race day. The person doing this is volunteering hours they'd rather spend recovering.
I've watched that cycle repeat club to club for years. The data was always there — it just wasn't in a place anyone could see.
Why I built cycling-stats.com
I build software for a living, and I got tired of watching clubs run their seasons through spreadsheets. So I built cycling-stats.com — a race management platform for cycling clubs, 100% free. No fees, no subscriptions, no catch.
It does the four things a season actually needs:
- Event line-ups — register riders per event with their grade and category, so results count where they should.
- Race-by-race results — positions, points, times/gaps and primes for each race, published as soon as they're entered.
- Live standings — per-event and per-season leaderboards, broken down by category, updated as results land.
- Club dashboard — a private, login-gated area where club admins manage the whole season, plus a photo gallery for each event.
Take a look at an example event page — grade tabs across the top, the results table with rank, time/gap, primes and status, and the photo gallery below it. That's what every club's race day can look like when the numbers land in one place instead of a clipboard.
The bottom line
The race decides the day; the points decide the season. If your club is still running results through a spreadsheet (or worse, paper), the platform is free — cycling-stats.com — no fees and no subscriptions, for every club. Your riders get to see where they stand at any time, and the admin gets their evenings back.
Spot a bug or want a custom utility built? I'd love to hear from you. Get in touch